
Definition and Goals
Statistics is a part of mathematics that is an effective tool for collecting, analysing, interpreting, presenting, and organizing data. To explain further let us see the definition, goal, key concepts, and applications of statistics in various fields.
Definition and Goal: Statistics entails gathering data from numerous sources, summarizing the data into relevant information, and deriving conclusions from the data. The fundamental goal is to use an organized technique to deal with uncertainty and unpredictability in real-world data to make sense of complex information.
Key Concepts
Key Concepts associated with Statistics
Data
The foundation of statistics is data, which can be quantitative (numbers) or qualitative (categorical). It is gathered through surveys, experiments, observations, and other means.
Descriptive Statistics
As the name suggest it deals with data summarization and presentation. Mean, median, and mode metrics help us know the central tendency of data, whereas standard deviation measures describe its variability.
Inferential Statistics
Again, as the name suggest this statistics analyses sample data to draw conclusions about larger populations. Hypothesis testing and confidence intervals uses such kind of statistics.
Probability
Statistics and probability theory are inseparable. It aids us in understanding the likelihood of various events occurring.
Uses of Statistics
Statistics is utilized in a broad variety of fields. Let us see with examples as follows:
- Scientific: For example, in a biology research project, experts are investigating the effects of a new medicine on cancer cell proliferation. They gather data on the size of cancer cell populations over time. Statistics assists them in analysing this data to evaluate whether the medicine is effective in reducing cell development. They may utilize statistical procedures such as t-tests or ANOVA, to compare different treatment groups,
- Commercial: As an example, a retailer wants to comprehend client behaviour. They acquire information about customer purchases, demographics, and web browsing habits. They can uncover factors impacting customer spending habits and modify marketing campaigns accordingly using statistical approaches such as regression analysis.
- Medication: As an example, clinical trials for a novel vaccine require testing it on a population sample. Statistics aid in determining if a vaccine is both effective and safe. For example, they could compare the infection levels of the vaccine group to those of a control group. It suggests vaccine efficacy if the vaccine group has considerably lower infection rates.
- Social Sciences: As an example, a sociologist wants to investigate the relationship between education and income. He/ She can identify correlations and develop conclusions by collecting survey data from a wide sample of people and employing statistical analysis. For example, they may discover that those with more education have greater salaries.
- Schooling: For instance, in an educational institution, pupils’ standardized test scores are collected over time. Trend analysis, for example, can be utilised to examine the effect of variations in teaching approaches. If average test scores rise after a new teaching method is implemented, this indicates its effectiveness.
- Finance: For instance, investment firms utilise statistics to manage their portfolios. They use previous stock price data to compute risk and return metrics such as standard deviation and expected returns. These statistics help in investment decisions and assist investors in making decisions aptly.
- Quality Assurance: As an example, a smartphone manufacturer collects data on the number of problems in a sample of phones. They can monitor the manufacturing process using statistical process control. A sudden spike in faults indicates a potential problem in the production process.
- Market Analysis: Assume a food company wishes to introduce a new product. They conduct surveys to get information about consumer preferences and opinions. Based on survey responses, statistical analysis can assist define the target population, evaluate market potential, and fine-tune product characteristics.
Types of Statistics
Let us deep dive into Descriptive and Inferential statistics one by one.
Descriptive Statistics
In simple words, it is data summarization and presentation. Mean, median, and mode metrics help us know the central tendency of data, whereas standard deviation measures describe its variability.
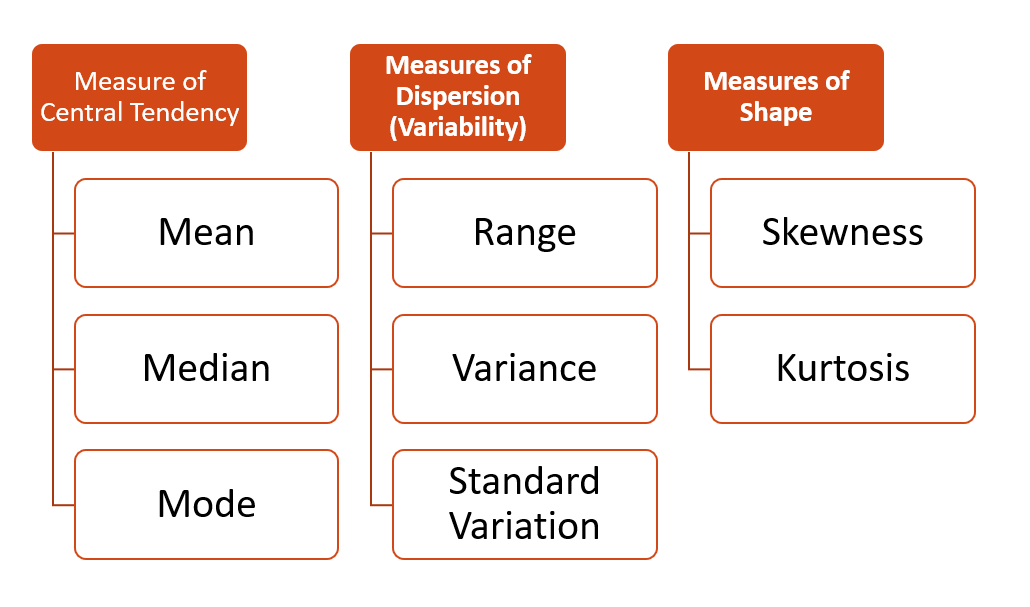 Measures of Central Tendency in Statistics
Mean (Average)
This is the sum of all values divided by the number of values. It represents the “typical” value in the dataset. It can be mathematically calculated as follows: Mean = (Sum of all values) / (Number of values).
Use: It represents the central value in the dataset by considering all the data points.
Median
The median is the middle value when the data is ordered or arranged from smallest to largest. If there is an even number of data points, the median is the average of the two middle values.
Use: It provides the middle point of the dataset, which is not influenced by outliers. It is particularly useful for skewed distributions.
Mathematical Representation: Median = Middle value when data is ordered
Mode
The mode is the value that appears most frequently in a dataset. A dataset can have one mode, more than one mode (multimodal), or no mode (if all values occur with the same frequency).
Use: It identifies the most common value(s) in the dataset and is often used for categorical or discrete data.
Mathematical Representation: Mode = Value(s) that occur with the highest frequency
Calculations – Mean Median Mode
Let us calculate Mean Median and Mode through an example as follows:
Let us say you have a dataset of the following exam scores: 78, 85, 90, 92, 45, 90, 88, 100.
Mean: (78 + 85 + 90 + 92 + 45 + 90 + 88 + 100) / 8 = 85.25
Median: When arranged in ascending order: 45, 78, 85, 88, 90, 90, 92, 100. In odd number of terms, it is the middle value. In even number of terms, it is average of two in between. Here, we have even number of terms. Hence, the median is (88+90) / 2 = 89.
Mode: 90 appears twice, which is more frequent than any other value. So, the mode is 90.
Measures of Dispersion (Variability) in Statistics
Range
The range is the difference between the maximum and minimum values in the dataset. It gives an idea of the spread of data.
Variance
Variance measures how data points deviate from the mean. A higher variance indicates greater variability.
Standard Deviation
This is the square root of the variance and provides a measure of how much data values typically deviate from the mean.
Measures of Shape in Statistics
Skewness
Skewness measures the asymmetry of the data distribution. Positive skew indicates a longer tail on the right, while negative skew has a longer tail on the left.
Kurtosis
Kurtosis measures the “tailedness” of the distribution. High kurtosis indicates more extreme values (heavy-tailed), while low kurtosis is lighter-tailed.
Real-Life Example and Inferences in Statistics
Let us take a real-Life Example of a retail store. You are the manager of a retail store, and you want to understand the sales performance of a particular product over the last month. You have daily sales data for that product. To gain insights, you use descriptive statistics:
- What would measure of Central Tendency suggest?
- Mean: You calculate the mean daily sales to find the average sales per day for that product.
- Median: You determine the median sales, which helps identify the typical sales day in case there are some unusually high or low sales days.
- Mode: You identify if there are specific days when the product sells exceptionally well, indicating potential patterns.
- What would measure of Dispersion suggest?
- Range: You calculate the range to understand how much daily sales vary from the lowest to the highest.
- Variance and Standard Deviation: These help you assess the consistency of sales. A low standard deviation implies more consistent daily sales, while a high one suggests greater variability.
- What would measure of Shape suggest?
- Skewness: If your sales data is positively skewed, it means that there are a few days with extremely high sales, while most days have moderate sales.
- Kurtosis: A high kurtosis indicates that there are some days with exceptionally high or low sales compared to a more normal distribution.
By applying descriptive statistics in this real-life scenario, you can get a comprehensive picture of your product’s sales performance. This information can guide inventory management, marketing strategies, and decision-making for the upcoming month.
Inferential Statistics
Inferential statistics is a branch of statistics that involves using data from a sample to make inferences or draw conclusions about a larger population from which the sample is drawn. This branch of statistics is essential for generalizing findings from a limited dataset to a broader context. Here is a detailed explanation of inferential statistics.
Key Concepts
The Key Concepts in Inferential Statistics:
-
Population and Sample
- Population: This refers to the entire group or set of individuals, elements, or items that you want to study or make inferences about. For example, if you want to understand the average income of all adults in a country, the population is all adults in that country.
- Sample: A sample is a subset of the population. Due to practical constraints, it is often not feasible to collect data from the entire population. Instead, you collect data from a sample, and inferential statistics helps you generalize the findings from the sample to the entire population.
-
Parameter and Statistic
- Parameter: A parameter is a numerical summary of a population. For instance, the average income of all adults in a country is a population parameter.
- Statistic: A statistic is a numerical summary of a sample. For the same example, the average income of the adults in your sample is a sample statistic.
-
Hypothesis Testing
- Hypothesis testing is a fundamental concept in inferential statistics. It involves making an educated guess (hypothesis) about a population parameter and then using sample data to test the hypothesis.
-
Confidence Intervals
- Confidence intervals provide a range of values within which a population parameter is likely to fall. They are used to quantify the uncertainty associated with estimates from a sample.
-
Significance Level and p-Value
- In hypothesis testing, a significance level (often denoted as α) is chosen to determine how strong the evidence must be before you can reject the null hypothesis. The p-value represents the probability of obtaining results as extreme as those observed, assuming the null hypothesis is true. If the p-value is smaller than the chosen significance level, the null hypothesis is rejected.
-
Statistical Models and Regression Analysis
- Statistical models, such as linear regression, logistic regression, and ANOVA, are used to analyse the relationships between variables and make predictions based on sample data.
Real-Life Example
Let us say a car manufacturer wants to estimate the average fuel efficiency (miles per gallon, or MPG) of all the cars they produce. It is impractical to measure the MPG of every single car due to the large population size. So, they take a random sample of 100 cars from their production line and calculate the average MPG in this sample.
Inferential statistics allows them to make conclusions about the average MPG of all the cars they produce by using the sample data. They can compute a confidence interval, e.g., “We are 95% confident that the average MPG of our cars falls between 30 and 35 MPG.”
This confidence interval provides a range within which the true population parameter (average MPG) is likely to lie, and it is a key outcome of inferential statistics.
Inferential statistics is a powerful tool for making informed decisions and drawing conclusions based on sample data, even when studying large populations is not feasible.
Conclusion
In conclusion, dear readers, statistics, both descriptive and inferential, provide the backbone of empirical research and decision-making. Descriptive statistics provide us with the lens to capture the key elements of data, allowing us to put together a vivid picture of the information at hand. Meanwhile, inferential statistics provide us with the tools we need to extend our insights into wider setting, enabling us to make more informed predictions and decisions.